Workflow Results Documentation
Create a function that takes the arguments geoserver_name, map_manager, and spatial_manager as such:
def build_results_tabs(geoserver_name, map_manager, spatial_manager):
...
Next, create instances of any result tabs you'd like and return them all in a list.
return [spatial_result, report_result]
Map Workflow Result
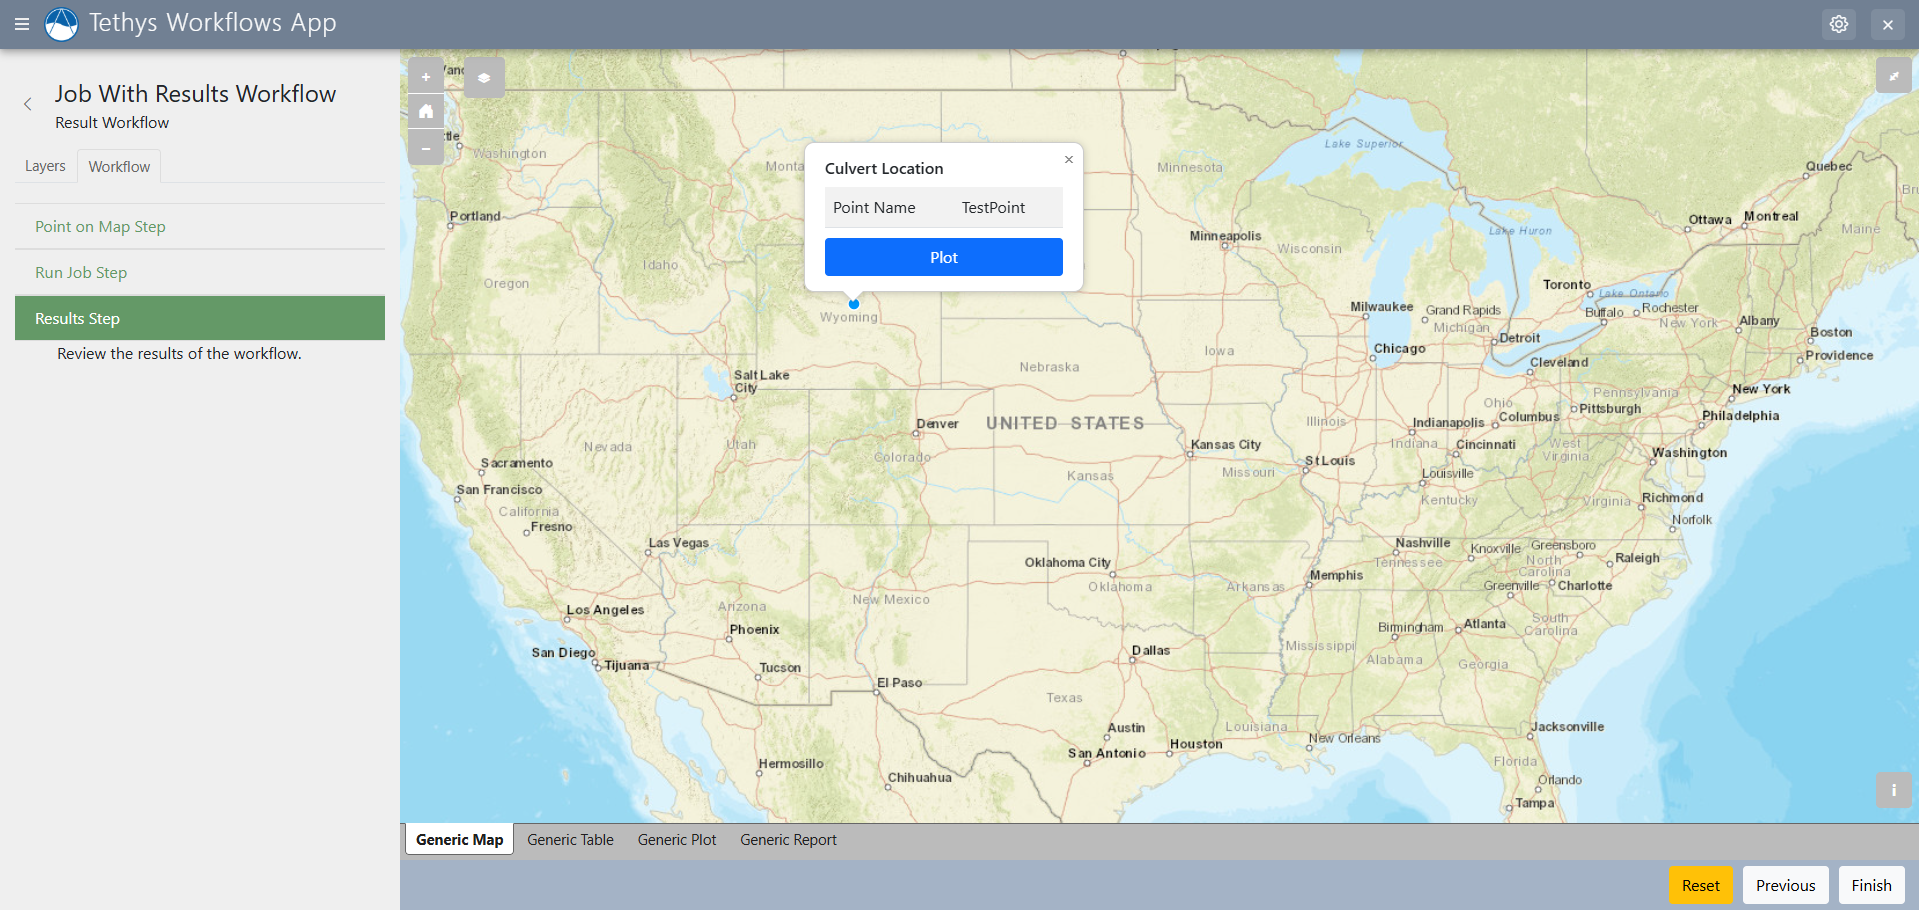
Spatial workflow results allow you to visualize any spatial data on an interactive map.
Options:
- layer_group_title(str): title for the layer group being displayed on the map.
- layer_group_control(str): type of control used for controlling the layer group layers being displayed.
Dataset Workflow Result
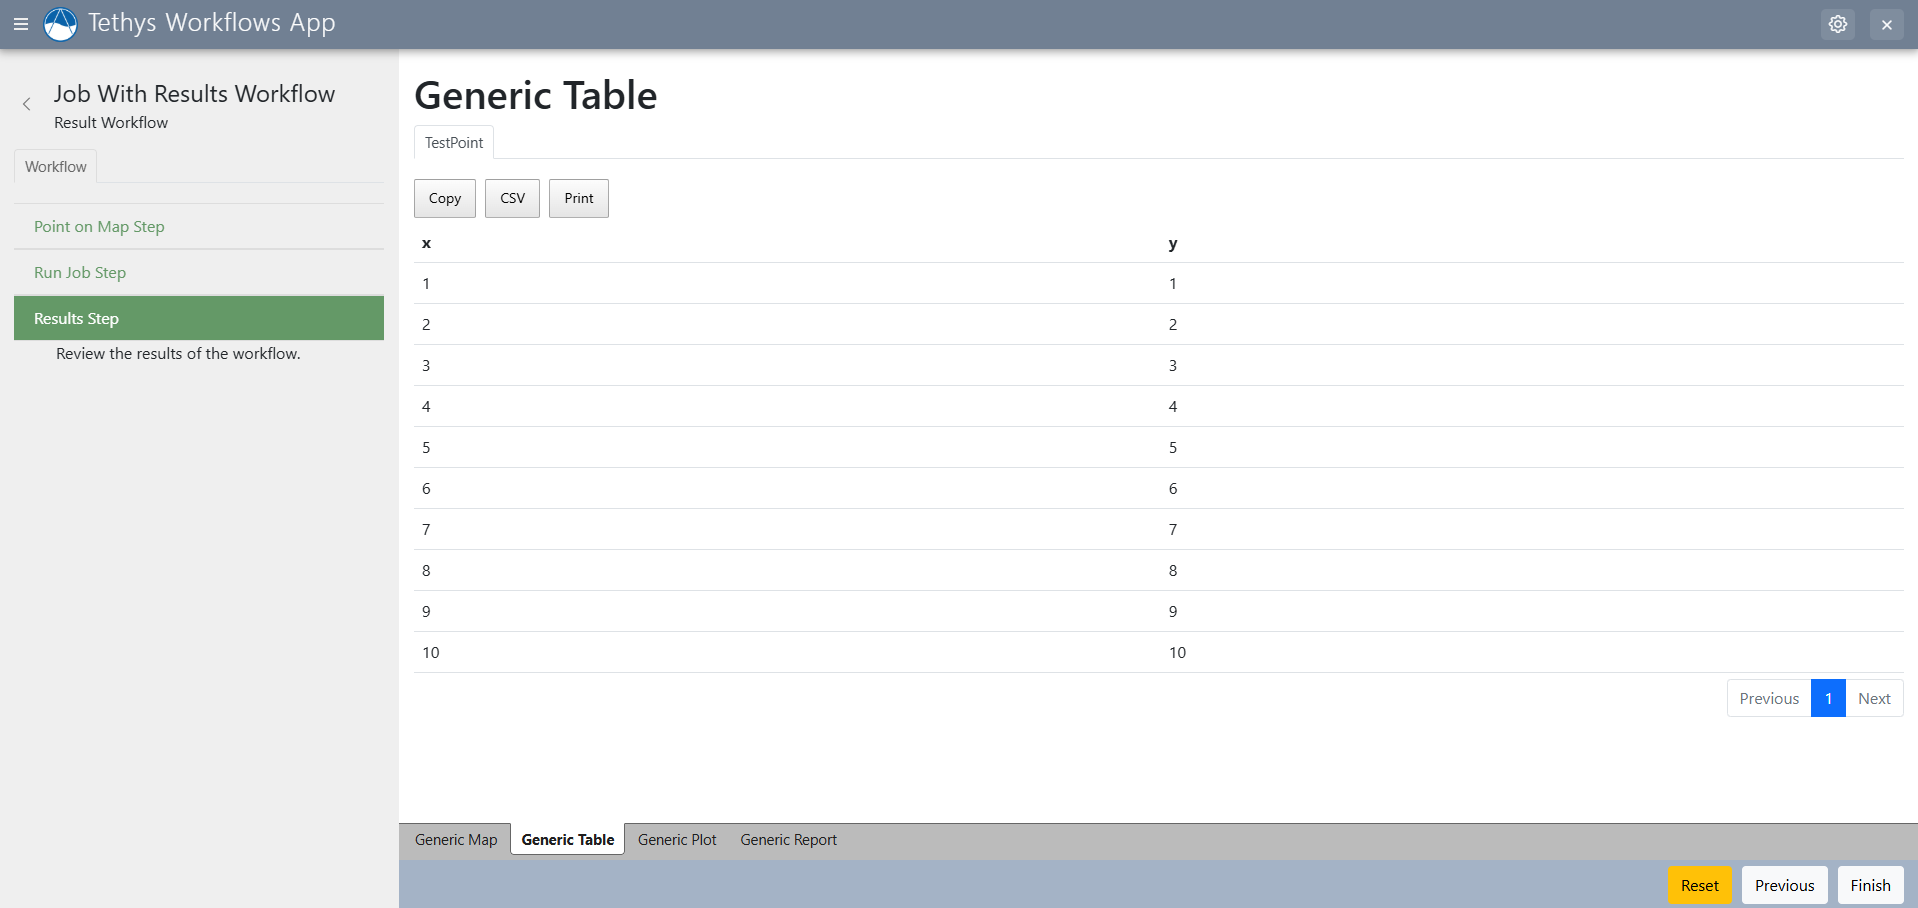
Dataset workflow result tabs allow for the visualization of datasets in tabular form.
Options:
- data_table_kwargs(dict): arguments for the data table(such as paging)
- no_dataset_message(str): message to be displayed if no datasets are provided or found.
Plot Workflow Result

Plot workflow result tabs provide an interactive graph interface for visualizing data in a plot.
Options:
- renderer (str): bokeh or plotly
- axes(list): A list of tuples for pair axis ex. For example: [('x', 'y'), ('x1', 'y1'), ('x', 'y2')]
- axis_labels(list): A list of label for x and y axes respectively. For example: ['x', 'y']
- plot_type (str): lines or scatter
- line_shape (str): Only for plotly. You can select from on of these options: linear, spline, vhv, hvh, vh, hv
- x_axis_type (str): type of x axis. Available options are 'linear' or 'datetime'
Report Workflow Result
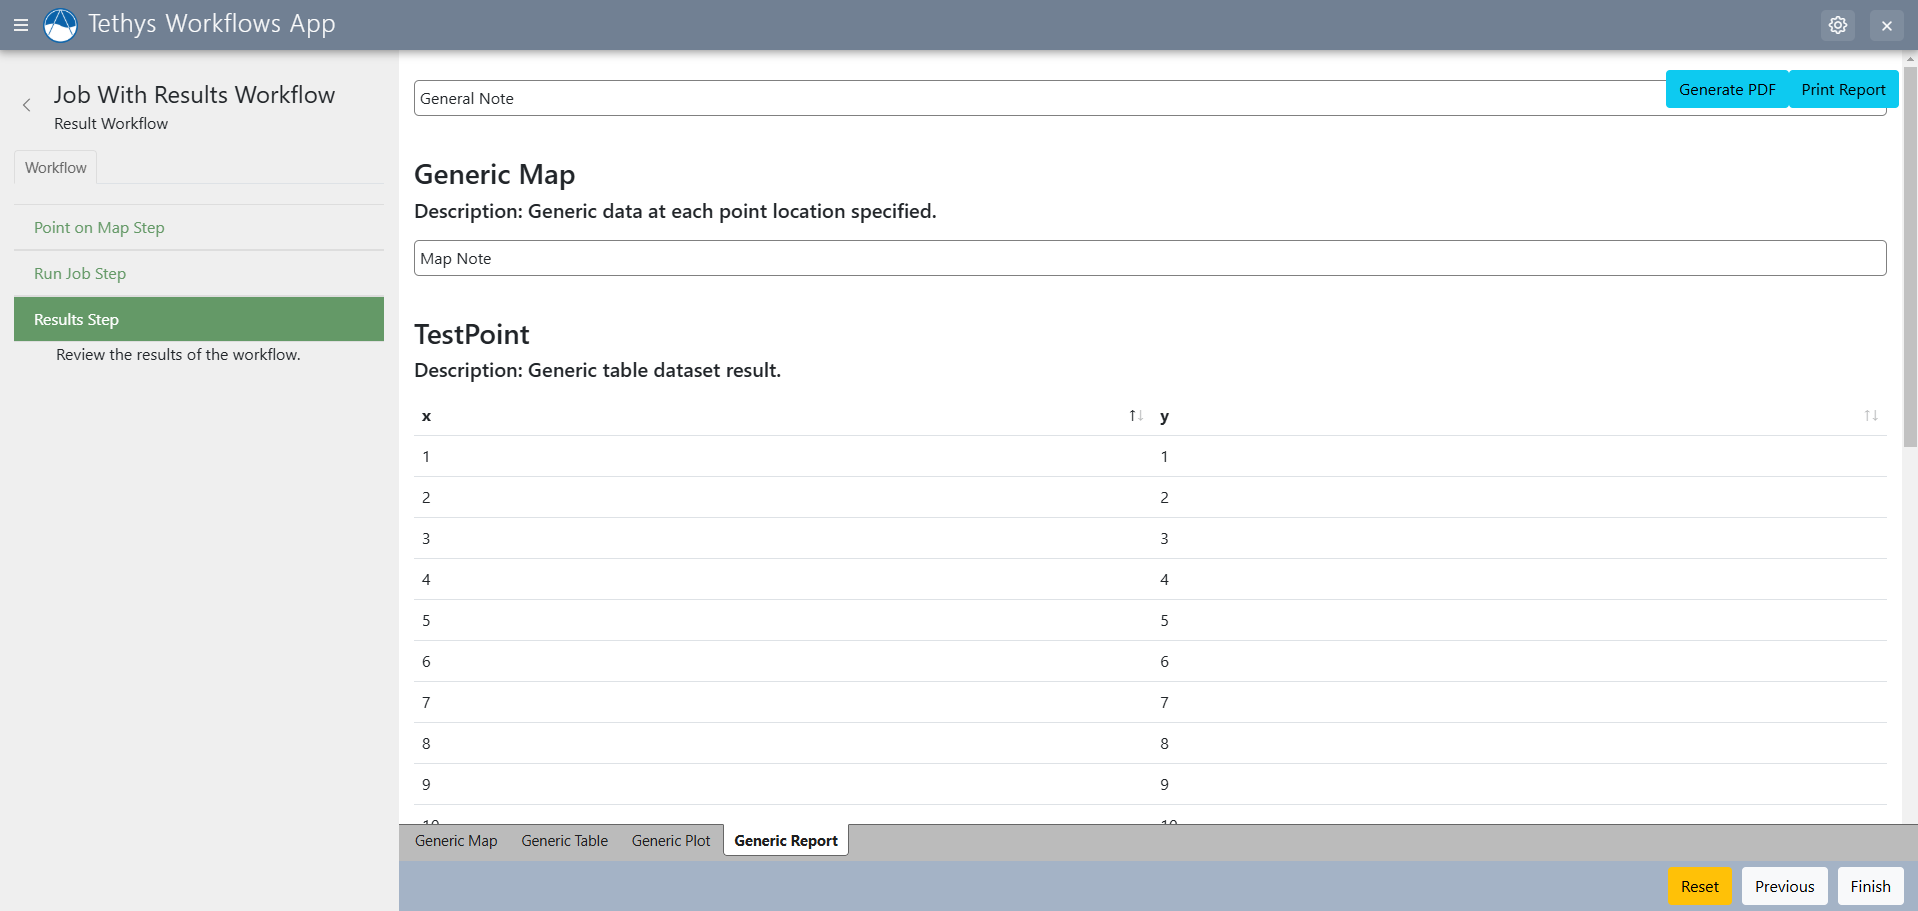
Report workflow results generate a report page on the workflow that can be put into PDF format or printed out. There are multiple fields for adding notes to steps or results.
Options:
- show_download_button (bool): Show a download button on the report. Set to
TrueorFalse. Defaults toTrue.